
Can Fluctuating Methylation Clocks track stem cell dynamics?

Figure 1 – (a) The three possible methylation states at a specific fCpG locus, within a particular diploid cell, reflecting the fraction of alleles methylated at that locus. (b) Illustration of how the methylation status at a specific fCpG locus, within a small niche of five stem cells, can change over time in relation to the experimental parameters considered by the mathematical model: a spontaneous methylation (μ), a spontaneous demethylation (γ), and a stem cell replacement (λ). [Image created with BioRender.com © 2022 all rights reserved]
Abstract
The molecular clocks allow to predict evolutionary separation of two or more species or the biological age of a specific tissue or organism. The young researcher Calum Gabbut and his collaborators[1], identified specific fluctuating CpG (fCpG) sites of DNA methylation, which can be used as molecular clocks to track the time between methylation and demethylation events, in order to predict the stem cells fate in adult tissues. These were called Fluctuating Methylation Clocks (FMCs). Through the FMCs methodology it was possible to estimate the replacement of mutated intestinal stem cells, and to distinguish the evolution of acute and chronic human blood leukemias.
Discussion
The ‘molecular clocks’ represent a technique born and applied in the evolutionary field, which allow to date the evolutionary separation of two or more species, through the study of the differences between the base sequences in their DNA or between the aminoacid sequences in some proteins[2]. Current human cytological studies, generally, use various types of somatic genomic alterations as molecular clocks, in order to reconstruct the ancestry of a cell population and reveal the fate of somatic cells.
The DNA methylation is the most studied epigenetic modification in mammals, including humans; it is carried out by a family of writers, the DNA methyltransferases (DNMTs), which catalyze the addition of a methyl group (-CH3) to the C-5 position of a cytosine, that precedes a guanine (CpG), forming 5-methylcytosine (5mC), and its function is suppression of transcription[3]. Therefore, in this study, the accuracy of a clonal dynamics traced by molecular clocks, depends, inevitably, on the DNA methylation and demethylation rate [1-4].
The fluctuating methylation states at a CpG locus
First of all, it was necessary to verify the hypothesis that, actually, certain CpG sites fluctuate, stochastically and measurably, in their DNA methylation states; specifically, the fraction of alleles showing fluctuations in their methylation levels, at certain CpG loci, was considered. Hence, the DNA methylation measurements provided by Illumina EPIC arrays, have allowed to identify three possible methylation states at a specific CpG locus, within a particular diploid cell, reflecting the fraction of methylated DNA at that locus (referred to as β value), between 0%, 50% and 100%, at which the cell can be homozygously unmethylated, heterozygously methylated and homozygously methylated, respectively (Fig. 1a). It’s the spontaneous transition between these states that allow methylation to act as a lineage tracing marker, making the fCpG loci a useful tool to infer stem cell dynamics that occur on a timescale of years or months, in blood, intestinal crypts and endometrial glands[1-5-6].
Mathematical model of the fCpG methylation
Moreover, a stochastic model has been developed, to describe how the β value of a single CpG locus, within a stem cell niche of fixed size S, changes over time. This mathematical model consists of a hidden Markov model, associated with a Bayesian inference framework, and it’s characterized with two state variables: k, which is the number of stem cells containing one allele methylated, and m, which is the number of stem cells containing both alleles methylated; the system considers also three possible events, that can change the methylation status at a given CpG locus:
- spontaneous methylation, given at a constant rate μ per allele per stem cell per year;
- spontaneous demethylation, given at a constant rate γ per allele per stem cell per year;
- stem cell replacement, given at a constant rate λ per stem cell per year.
To verify the accuracy of this mathematical model, in inferring the stem cell dynamics, an early simulation in silico was performed: three synthetic intestinal crypts have been generated, each containing a five stem cell niche, with a mean replacement rate of 1 stem cell per year, and three different (de)methylation rate. Therefore, assuming that the dynamics of a stem cell niche is described exclusively by the experimental parameters considered by the model, and starting from the possible initial conditions, different versions of the various stem cell dynamics are obtained. The three final β value distributions are shown in Figure 2.
Only the resulting methylation distribution in orange (Fig. 2) shows the characteristic trimodal W-shape, with the three peaks (0%, 50% and 100%) indicating the fraction of methylated DNA at the fCpG loci, and reflecting the real experimental data. The purple and blue distributions, calculated starting from a very low and a very high (de)methylation rate, did not instead reflect the experimental data.
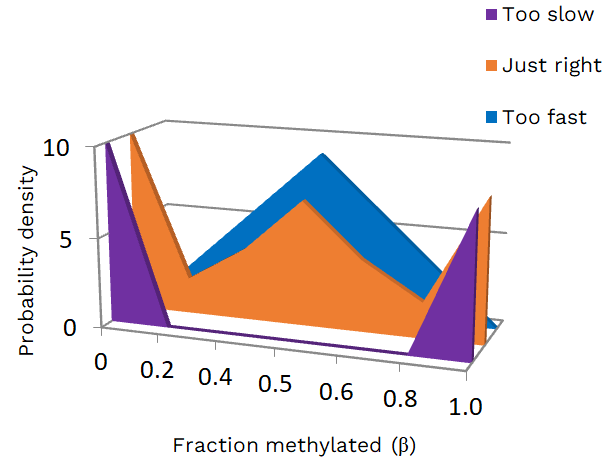
Figure 2 – In silico simulated fCpG methylation distributions from individual crypts. ‘Too slow’, ‘just right’ and ‘too fast’ refer to the measurements of methylation and demethylation rate, μ and γ, respectively. [ © 2022 all rights reserved]
So, applying this mathematical model to the methylation pattern of a stem cell niche, like taking a snapshot, over time, of a particular condition, it’s possible to deduce the replacement and the number of stem cells, and, thereby, to predict a specific stem cell dynamic[1].
The fluctuating methylation states at a CpG locus
For the trials of this study, the authors measured the DNA methylation level, by using Illumina EPIC arrays, of 31 colon and 28 small intestinal healthy crypt samples, to identify and select the fluctuating CpG loci, to use them as molecular clocks. In particular, fCpG loci shared between small intestine and colon were considered, to avoid a potential functional role. Moreover, the fCpGs were enriched on poorly expressed genes, confirming their non-association with regulatory functions and biased selective pressures.
The FMCs methodology was then applied on experimental data obtained for the crypts of the colon, the small intestine and the colon of patients with familial adenomatous polyposis (FAP), to measure and compare their stem cell dynamics[1].
FAP is an inherited disease caused by heterozygous germline mutations in the oncosuppressor gene APC, involved in the Wnt/β-catenin pathway, which plays an important role in the signaling of Cancer Stem Cells (CSC). It’s a condition characterized by the formation of benign polyps spread in the colon, but, usually over 40 years old, can also evolve in malignant. Thus, pathogenic APC mutations cause alterations in the Wnt signaling and in the maintenance of intestinal stem cell homeostasis[7-8].
From the methylation distributions obtained for the crypts of the colon and small intestine, was estimated that the replacement rate (λ) in the small intestine was lower than in the colon, despite the colon has fewer stem cells per crypt than the small intestine. The most significant result was estimated by the methylation distribution in the crypts of the colon with FAP, in which the replacement rate (λ) was twice respect to healthy colon. Therefore, it can be deduced that stem cells with altered dynamics, such as mutated stem cells dividing faster, go to replace other stem cells more quickly. These data suggest that the change of the replacement rate (λ) increases the stem cell competition.
FMCs in human blood
The FMCs have also been found in the whole human blood. Blood is a well-mixed population with different cell types and polyclonal origin. The fCpG loci were identified from a database containing whole blood DNA methylation of 656 healthy individuals. Normal polyclonal blood sample β value is concentrated near 50%, making an average of CpG loci random fluctuations between 0%, 50% and 100% methylation in individual cells. Thus, normal hematopoietic stem cell turnover is not synchronized, moreover the variance is low and stable because is maintained by a large number of stem cells. The interesting thing was observed when comparing samples with acute lymphoblastic leukemia (ALL) and chronic myelomonocytic leukemia (CMML), where the clonal cancerous population expands. In fact, fCpG were able to detect the clonal hematopoiesis, showing that clonal peaks begin to separate from the 50% peak. Acute leukemia shows an increase in the fCpG variance and the W-shape distribution (with separated peaks at 0% and 100%), thus representing the rapid clonal expansion of single population and synchronized fluctuations. While chronic leukemia shows lack of W-shape distribution because of a slower growth expansion and desynchronized fluctuations. Further, an hematopoiesis simulation, made with a simple model, confirmed the observed methylation distribution in human data. So, it can be inferred that variance of the fCpG methylation distribution is an indicator for the rapidity of the clonal expansion within the blood[1].
Conclusions and future prospects
This study[1] demonstrated that human somatic stem cell dynamics, competition and clonality are quantitatively measurable and comparable, using FMCs as lineage tracing markers in different types of human tissues. Furthermore, FMCs methodology allows to distinguish acute and chronic neoplasms in human blood, discriminating rapid and slow clonal hematopoietic growth. However, the mathematical model, developed to describe the methylation distribution of fCpGs, can only be valid under the following assumptions: (1) no selective pressure has to occur on the methylation event, (2) use of selectively neutral fCpG loci as markers, (3) homogeneous cell population in the tissue and (4) no linkage between the CpG loci.
Overall, through the FMCs methodology it’s possible to measure genomic alterations that begin or recur later in life and, at the same time, to predict the risky consequences that could occur within a few years, finding a wide range of application in the molecular diagnostic for other human somatic cell populations, e.g. for the brain cells. Indeed the methylation of particular DNA sequences is already considered a marker for several neurodegenerative disorders, such as Alzheimer’s disease or Parkinson’s disease, and even in some psychiatric conditions, such as schizophrenia, depression or personality destroyers[3]. Besides, the FMCs can be efficiently used in the study of carcinogenesis and in the early detection of cancer, as a prognostic marker that, detecting mutated cells through tracking their anomalous replacement and competition, is able to signal a probable neoplastic progression. In this way, it’s possible to carry out prevention in the patient, selecting the most efficient and personalized treatment.
References
- Gabbutt, C., Schenck, R.O., Weisenberger, D.J. et al. Fluctuating methylation clocks for cell lineage tracing at high temporal resolution in human tissues. Nat Biotechnol (2022). https://doi.org/10.1038/s41587-021-01109-w
- Sadava D., Hillis D.M., Heller C., Hacker S. Biologia, V ed. Zanichelli 2019, vol. III: L’evoluzione e la biodiversità, pp. 494-495.
- Romani M. Epigenetica, Zanichelli 2021, pp.9-15.
- Graham, T.A., et al. Use of methylation patterns to determine expansion of stem cell clones in human colon tissue. Gastroenterology 140, 1241-1250 (2011).
- Lee-Six, H. et al. Population dynamics of normal human blood inferred from somatic mutations. Nature 561, 473-478 (2018).
- Blokzijl, F. et al. Tissue-specific mutation accumulation in human adult stem cells during life. Nature 538, 260-264 (2016).
- Zhan, T., Rindtorff, N. & Boutros, M. Wnt signaling in cancer. Oncogene 36, 1461-1473 (2017).
- Pinto, D. & Clevers, H. Wnt control of stem cells and differentiation in the intestinal epithelium. Exp. Cell. Res. 306, 357-363 (2005).